Research "Russian consumer market and FMCG retail chains rating"
- Release date: 08.11.2019
- Number page: 187
- Lang. report: English
- Price:27500 Ёґс 374 USD 315 EUR

Relevance of the study "Food Retail and the Russian Consumer Market"
At the end of 2024, changes in consumer behavior began to take shape, which resulted in a slowdown in traffic growth in chains with a focus on the low-price segment, while maintaining the dynamics of retailers and channels offering an expanded range (supermarkets, hypermarkets, specialized chains). By the end of 2024, retail trade turnover in comparable prices increased by 7.2% to RUB 55.6 trln: retail sales of food products increased by 6.0% to RUB 26.5 trln, and nonЦfood products - by 8.3% to RUB 29.1 trln.
In 2024, against the background of reduced marketing investments by market participants, rising costs per last mile and a shortage of couriers, the E-grocery market slowed down. The share of online sales of food products in the total volume of retail sales of food and beverages increased to 4.8% by the end of 2024.
In order to analyze in detail the state of the retail market and understand how and in what segments and formats it will develop, we have prepared this review. With this product, you will be able to analyze the company"s development in comparison with competitors and market indicators in general, as well as prepare a strategic business development plan.
Research objectives:
overview of FMCG retail industry indicators;
compilation of ratings of FMCG segment retailers by revenue, number of retail facilities, volume of retail space, by trade formats and regions of presence;
overview of the vector of industry development by describing the most important events;
forecasting the development of the industry;
development of a scenario forecast for the development of the Food retail market;
analysis of the activities of the largest companies in the industry;
analysis of consumer behavior of the population;
review and analysis of government regulation.
Areas of use of the research results: benchmarking, competitor analysis, marketing and strategic planning, customer and partner search, preparation for negotiations with retail chains.
Advantages of the study:
innovative format in the form of an electronic presentation;
structured description and analysis of FMCG market trends and prospects;
forecasts for the development of the largest FMCG chains;
The research is based on an annually updated and replenished database of more than 1,000 of Russia"s largest retail chains in various areas of trade. Throughout the year analysts non-stop collect, aggregate, verify, and analyze operational and financial indicators of Russian retail companies;
ratings of FMCG retail chains (TOP-10) by financial and operational indicators;
FMCG retail chain ratings (TOP-5) by federal district;
Objectives and structure of the study by sections:
Key economic trends in Russia in 2025
Part I. Retail and consumer market indicators Macroeconomic indicators of retail trade: GDP dynamics and structure. Dynamics of key balance of payments indicators. Exchange rate and key rate dynamics. Consumer price index. Retail trade turnover. Retail turnover by types of goods. Demography and migration. Consumer appending dynamics. Consumer confidence. Household income dynamics. The structure of monetary income and expenses of the population. State of consumer lending and deposits. Deposit volume. Consumer and mortgage loans.
Part II. Key retail events Government regulation of retail trade.
Part III. FMCG retail indicators Structure of food retail turnover. Number and selling space of TOP-200 FMCG chains. Selling space structure and growth of TOP-200 FMCG chains. Selling space structure of TOP-200 FMCG chains by formats. Food retail market structure. Food market share dynamics of TOP-10 FMCG retailers. Rating of TOP-10 FMCG retailers. Rating and performance of publicly listed FMCG retail chains. Comparable sales of public FMCG retail chains. Financial performance and investments of public FMCG retail chains. Stock prices and capitalization of publicly listed FMCG retail chains.
Part IV. Russian retail development cases
Part V. Online-sales and E-grocery E-grocery market dynamics. INFOLine E-grocery Russia Top Rating. E-grocery market structure. Omnichannel development strategies of leading FMCG chains
Part VII. Regional retail development FMCG Regional structure of the RTT, Food and Non-Food. FMCG chains ratings for 8 federal districts, as well as for St. Petersburg and Leningrad region, Moscow and Moscow region.
Information sources:
data from the Federal State Statistics Service, the Ministry of Economic Development of the Russian Federation, and the Central Bank of the Russian Federation;
reports and reports of international and domestic companies in accordance with IFRS;
survey, monthly survey and interviewing of more than 200 FMCG retail chains, data from the largest retailers (website materials, press releases), monitoring of openings and closures of retail facilities in the Russian Federation;
INFOLine analytical databases: "TOP 200 largest FMCG retail chains in Russia";
INFOLine ratings: INFOLine RETAIL RUSSIA TOP-100, FMCG RETAIL RUSSIA TOP, DIY RETAIL RUSSIA TOP, HOUSEHOLD RETAIL RUSSIA TOP, etc.; INFOLine research: INFOLine Retail Russia TOP-100, "DIY Russia Market", "Household Russia Market";
regular media monitoring within the framework of the Thematic News services: "Food industry and the Russian food market", Thematic news: "Food retail and FMCG Russia retail chains"
materials from Russian and foreign media (federal and regional press, news agencies), as well as industry press.
а
We remind you that INFOLine customers receive the most favorable terms of service, discounts, participation in industry events, as well as their materials.
Expert support of our product has become one of the most popular options when subscribing to INFOLine"s quarterly industry review "Food Retail and the Russian Consumer Market " in recent years.
How does it work?
INFOLine experts offer you:
discuss the research results with your company"s specialists, focusing on key indicators and key industry trends;
speaking at your company"s corporate event with an analytical report and an extended presentation;
participation in your company"s client conference (speaker integration, moderation, industry analytics).
You: purchase our industry review " Food Retail and the Russian Consumer Market". We will help you effectively apply it in your company"s work.
If you are not interested in ready-made INFOLine research, then you can request a brief for the preparation of an individual Study HERE
Detailed content of the report:
Part I. Retail and consumer market indicators
1.1. GDP dynamics and structure
1.2. Dynamics of key balance of payment indicators
1.3. Exchange rate and key rate dynamics
1.4. Consumer price index
1.5. Retail trade turnover
1.6. Retail turnover by types of goods
1.7. Demography and migration
1.8. Consumer spending dynamics
1.9. Consumer confidence
1.10. Household income dynamics
1.11. The structure of monetary income and expenses of the population
1.12. State of consumer lending and deposits
1.13. Deposit volume
1.14. Consumer and mortage loans
PART II. Key retail events
2.1. Goverment regulation of retail trade
PART III. FMCG retail indicators
3.1. Structure of food retail turnover
3.2. Number and selling space of TOP-200 FMCG chains
3.3. Selling space structure and growth of TOP-200 FMCG chains
3.4. Selling space structure of TOP-200 FMCG chains by formats
3.5. Food retail market structure
3.6. Rating of TOP-10 FMCG retailers
3.7. Rating and performance of publicly listed FMCG retail chains
3.8. Comparable sales of public FMCG retail chains
3.9. Financial performance and investments of public FMCG retail chains
3.10. Stock prices and capitalization of publicly listed FMCG retail chains
PART IV. Russian retail development cases
PART V. Online-sales and E-Grocery
5.1. E-grocery market dynamics
5.2. INFOLine E-grocery Russia Top Rating
5.3. E-grocery market structure
5.4. Omnichannel development strategies of leading FMCG chains
PART VI. Regional retail development FMCG
6.1. Regional structure of the RTT
6.2. Regional structure of the RTT Food
6.3. Regional structure of the RTT Non-Food
6.4. Rating of the largest retail chains in Moscow and the Moscow Region
6.5. Rating of the largest retail chains in the Central FD (CFD excluding Moscow and the MR)
6.6. Rating of the largest retail chains in St. Petersburg and the Leningrad region
6.7. Rating of the largest retail chains in the North Western FD (NWFD excluding SPB and the LR)
6.8. Rating of the largest retail chains in the Volga FD (VFD)
6.9. Rating of the largest retail chains in the Urals FD (UFD)
6.10. Rating of the largest retail chains in the Southern FD (SFD) and North Caucasian FD (NCFD)
6.11. Rating of the largest retail chains in the Siberian FD (SFD) and Far Eastern FD (FEFD)
Classification of retail facilities by format
List of sources
Usage agreement
About the author Ч INFOLine groups of companies
Key economic trends in Russia in 2025
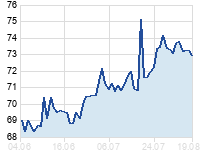
Dynamics of foreign exchange rates to ruble
Russias federal budget deficit and surplus, RUB trillion
Consumer price index, % versus the same month last year
Loan interest rates and key rate of CBR, national banks and FRS, %
Part I. Retail and consumer market indicators
PART III. FMCG retail indicators
PART IV. Russian retail development cases
PART V. Online-sales and E-Grocery
PART VI. Regional retail development FMCG
All ratings of the largest FMCG chains by Federal Districts include the following charts: